Ryan Hafens has recently started what is promised to be a series of blog posts about his geofacet package. In the first post, he argues the case for where this approach has advantages over other forms of choropleth. I have previously looked at the hexmap approach - which may or may not be still working
It is possible to create one’s own map to apply to geofacetting but luckily one has already been created for the nine provinces of South Africa - where I am currently visiting
There is also a Nesstar portal where it is possible to download lots of census and household survey data in many types of format, including csv - along with an invaluable pdf describing the data
2016 Household survey
The 12MB I previously downloaded takes a few seconds to read in but results in a data.frame with 274 columns; so there are quite a lot of variables available to plot.
Roofing
Lets summarize by province the variable, Q52Roof, which indicates for each household the construction material for the roof
## # A tibble: 98 x 3
## # Groups:   Prov [?]
##     Prov Q52Roof     n
##    <int>   <int> <int>
##  1     1       1     3
##  2     1       2    37
##  3     1       3   700
##  4     1       4     4
##  5     1       5     8
##  6     1       6     1
##  7     1       9   745
##  8     1      11     6
##  9     1      12   623
## 10     1      13     3
## # ... with 88 more rows
Well that looks okay, as far as it goes, but there are a few points to address
- The Provinces need to be named
- The Type of Roof needs to be described
- The Numbers need to be a percentage - Combining the small values will make chart neater
## # A tibble: 36 x 3
## # Groups:   description [?]
##    description province         pc
##    <chr>       <chr>         <dbl>
##  1 Asbestos    Eastern Cape  13.2
##  2 Asbestos    Free State     6.00
##  3 Asbestos    Gauteng        7.80
##  4 Asbestos    KwaZulu-Natal 13.8
##  5 Asbestos    Northern Cape  6.90
##  6 Asbestos    Western Cape  29.0
##  7 Cement      Gauteng        4.10
##  8 Corrugated  Eastern Cape  68.6
##  9 Corrugated  Free State    80.3
## 10 Corrugated  Gauteng       56.6
## # ... with 26 more rows
We now have data we can plot using ggplot and geofacet
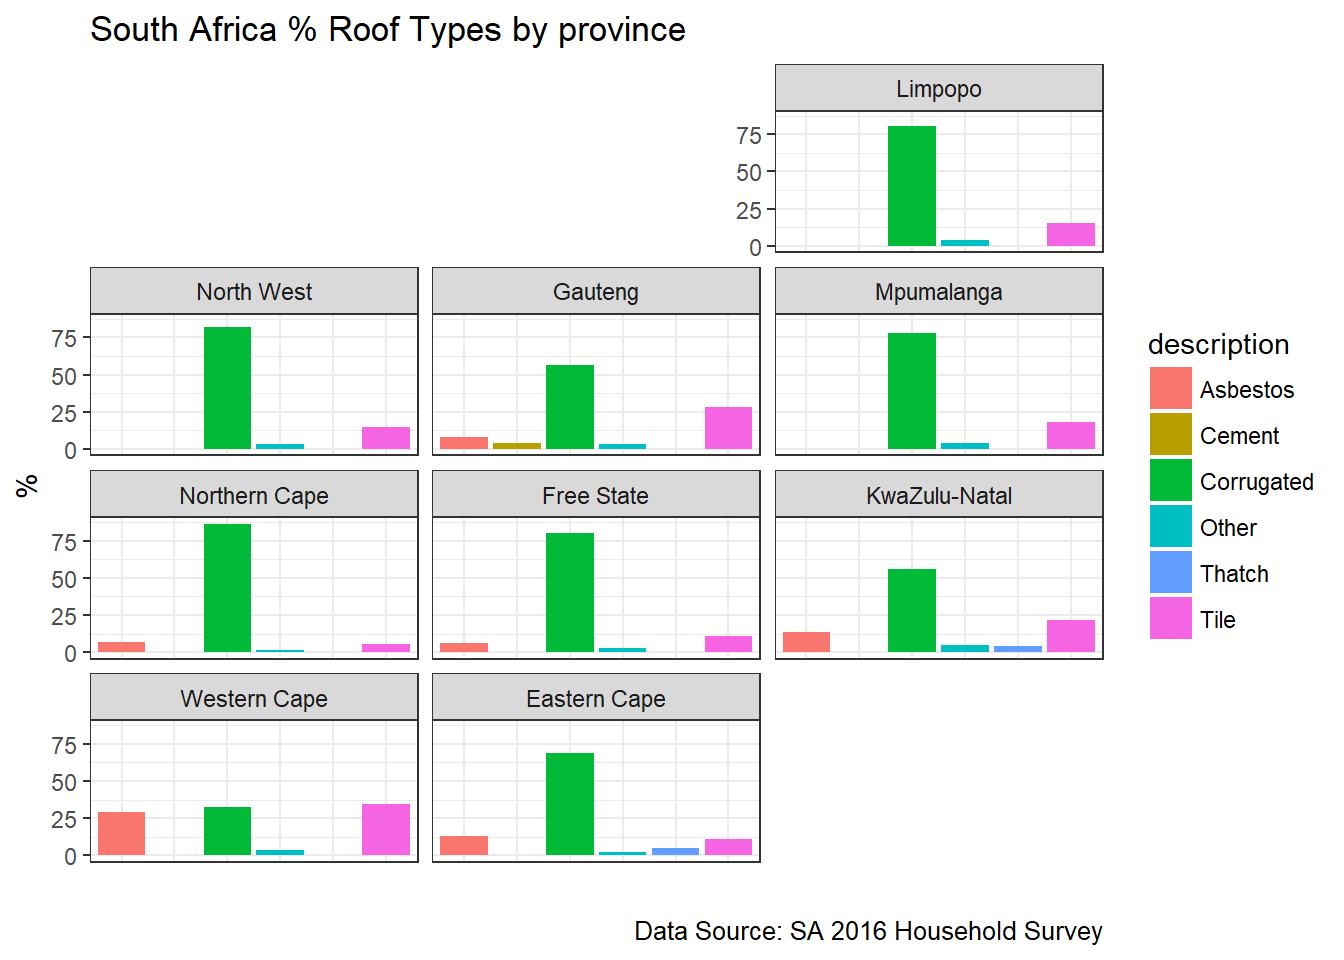
So Corrugated Iron/Zinc - associated with shacks - rules, other than in the Western Cape province where asbestos and tile account for similar proportions
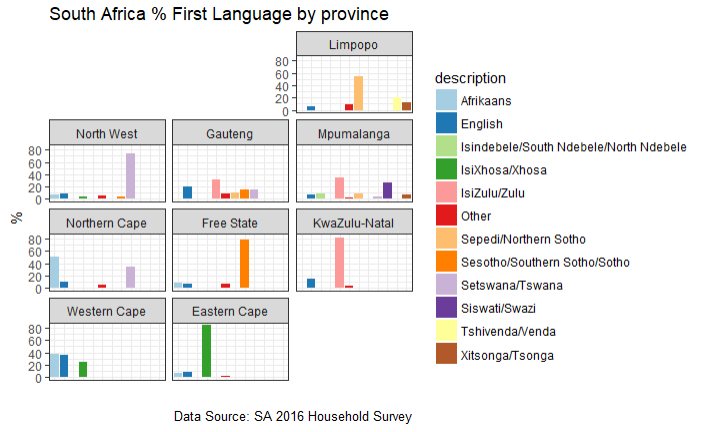
Language
South Africa has 11 official languages(!) - with probably English the most used in business and as a second language
The data provides the language in which the main part of the interview conducted( Q101Lan) so should give some indication of language dispersion
We can follow a similar procedure to that above
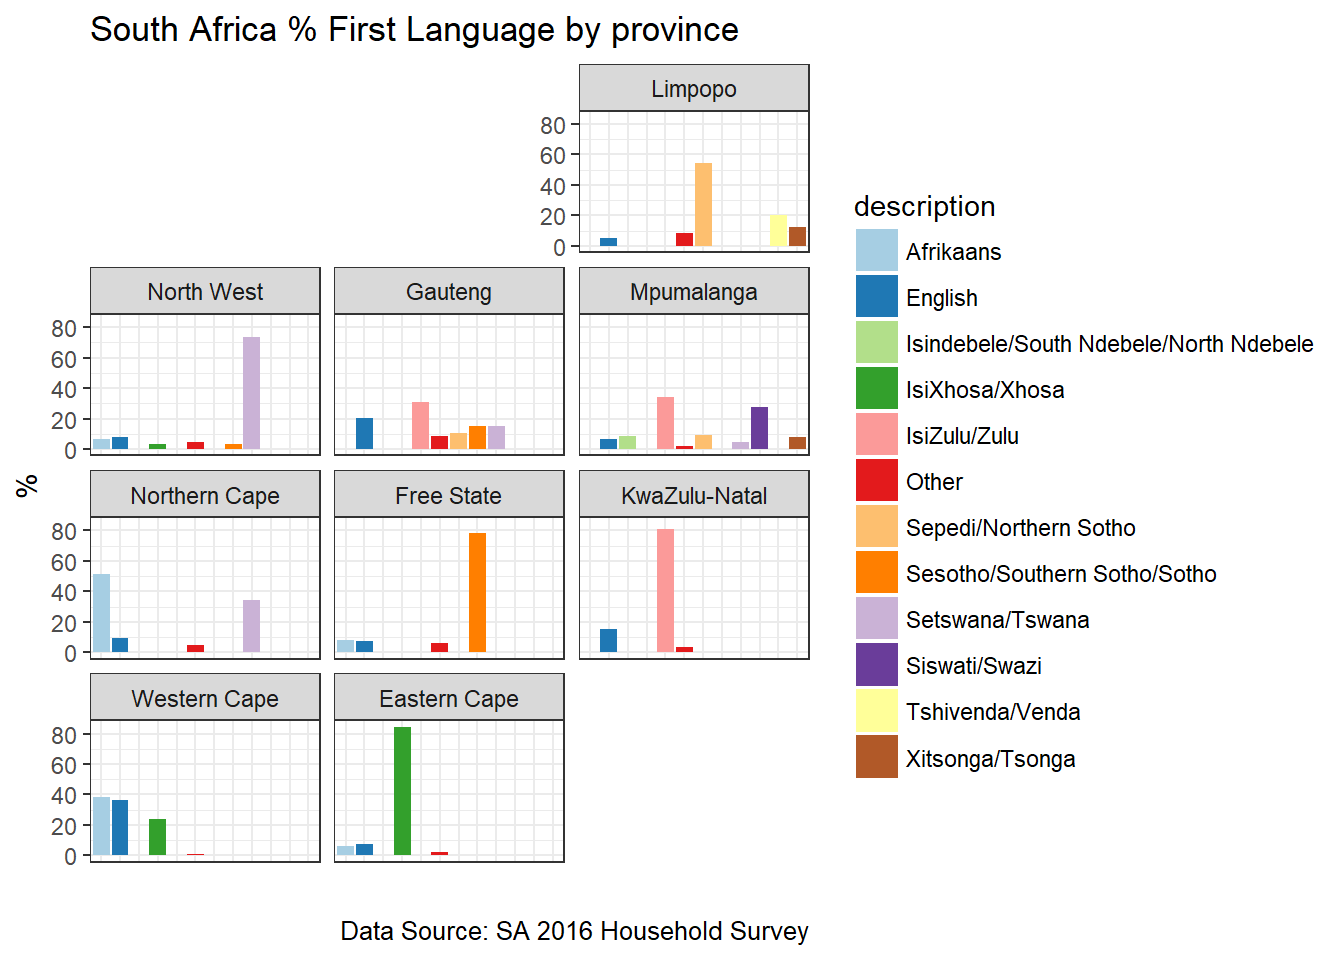
This method of mapping highlights both the extereme variation across the provinces and how different languages can be very dominant by region
Below is an interactive chart showing the main language, by province. Hover points for exact percentage
So this should give you the idea of geofacetting, although the two examples I looked at did not particularly highlight any geographical drift