From being an avid daytime moviehouse attendee. I have retreated to the occasional Netflix viewing at home. Although the ‘Because you watched’ algorithm works fairly well The Matching on Netflix does not work for me so I’d kinda like to get a rating from a reputable source maybe along with a review
As I’m a Guardian reader, a recent post by Maelle Salmon on extracting data from their Experience columns gave me a nudge to do something and I have used her code as a template for my works. So my thanks to her
Here is an extract from a typical reviews summary page

This seems to give me some of what I want but extracting the rating from the page proved problematic and it would also be nice to have the reviewer’s name and date.
So this turns into a two phase process. Garner the links from the summary pages and then call these pages up for most of the data
In addition to the usual suspects, I’ll use the rvest package to scrape and the robotstxt to ensure that scraping is acceptable
library(tidyverse)
library(plotly)
library(rvest)
library(stringr)

library(robotstxt)
Firstly, the review links. If you read Maelle’s Salmon’s post you will see that to adhere to scraping etiqutte you can check if the path you want is allowed
robotstxt::paths_allowed("https://www.theguardian.com/film+tone/reviews")
## [1] TRUE
Phew!
You should also set a crawl delay. The Guardian specifies one second. As this example only scrapes a couple of pages of reviews I will dispense with that - though of course in larger scale one should. That’s what nights are for, after all
There are over 800 summary pages going back more than a decade. I’ll just process the first two for this demonstration. The tricky part is often determining the correct nodes for your needs. Either use the selectorGadget, inspect via developer tools or ‘View Source’
 # function to obtain urls of individual reviews
 xtract_links <- function(node) {
    css <- '.fc-item__title a'
    link <- html_nodes(node, css) %>% html_attr('href')
  }

  # function to obtain page content from summary pages
  get_links_from_page <- function(page_number){
    #Sys.sleep(1)
    link <- paste0("https://www.theguardian.com/film+tone/reviews?page=", page_number)
    page_content <- read_html(link)
    xtract_links(page_content)
  }

 # use purr to obtain a vector of review urls
  review_links <- map(1:2, get_links_from_page) %>% unlist()

  review_links[1:3]
## [1] "https://www.theguardian.com/film/2017/nov/10/fireworks-review-anime"
## [2] "https://www.theguardian.com/film/2017/nov/10/a-caribbean-dream-review-shakespeare-midsummer-nights-dream-adaptation"
## [3] "https://www.theguardian.com/film/video/2017/nov/09/watch-the-trailer-for-the-florida-project-video"
So what is returned is a character vector, length 40, of the most recent reviews. These are generally of an individual film but might be a more wide ranging article
OK, lets get the details for these 40. The broad approach of the previous chunk code is replicated. It takes a few seconds even without inserting the courtesy 1 second delay
 xtract_info <- function(review_content){

    title <-review_content %>%
      html_node(xpath = '//meta[@property="og:title"]') %>%
      html_attr('content')

    description <-review_content %>%
      html_node(xpath = '//meta[@property="og:description"]') %>%
      html_attr('content')

    author <-review_content %>%
      html_node(xpath = '//meta[@name="author"]') %>%
      html_attr('content')

    date <-review_content %>%
      html_node(xpath = '//meta[@property="article:published_time"]') %>%
      html_attr('content')

    categories <-review_content %>%
      html_node(xpath = '//meta[@property="article:tag"]') %>%
      html_attr('content')

    rating <- review_content %>%
      html_node(xpath = '//span[@itemprop="ratingValue"]') %>%
      html_text()

    data.frame(title=title,description=description,author=author,date=date,categories=categories,rating=rating)

  }

  get_info_from_review <- function(url){
     #Sys.sleep(1)


    review_content <- read_html(url)
    xtract_info(review_content)
  }

  review_info <- purrr::map_df(review_links, get_info_from_review)

  ## tabulate data for paging/searching/ordering
  review_info %>%
     DT::datatable(class='compact stripe hover row-border order-column',rownames=FALSE,options= list(paging = TRUE, searching = TRUE,info=FALSE))
OK. That seems to work fine but there is some tidying up to do. Let’s just glimpse the structure
str(review_info)
## 'data.frame': 40 obs. of 6 variables:
## $ title : chr "Fireworks review anime romance sparkles with strangeness" "A Caribbean Dream review Shakespeare goes to carnival" "Watch the trailer for The Florida Project video" "The Florida Project review a wondrous child's-eye view of life on the margins" ...
## $ description: chr "This disorientating teen tale think Japans answer to Sliding Doors follows the divided destinies of three "| __truncated__ "Shakirah Bournes tender-hearted adaptation of A Midsummer Nights Dream is a refreshingly low-key palate clean"| __truncated__ "The Florida Project is the latest film from director Sean Baker, written by Baker and Chris Bergoch, starring W"| __truncated__ "A young cast give brilliantly naturalistic performances in this glorious story about a bunch of deprived kids "| __truncated__ ...
## $ author : chr "Peter Bradshaw" "Cath Clarke" NA "Peter Bradshaw" ...
## $ date : chr "2017-11-10T09:00:14.000Z" "2017-11-10T06:00:11.000Z" "2017-11-09T18:47:57.000Z" "2017-11-09T15:40:43.000Z" ...
## $ categories : chr "Animation,World cinema,Film,Culture,Anime,Japan,Teenage" "Film adaptations,Film,Culture,William Shakespeare,Caribbean,World cinema" "Film" "The Florida Project,Culture,Film,Drama,Willem Dafoe" ...
## $ rating : chr "3" "3" NA "5" ...There are a few things to address
- title is really a title and tagline
- date needs to be changed to a date field and time is irrelevant
- categories: if this was list-column we could extract genre more easily
- rating might be better as integer for future processing
- add the url for linking to Guardian web page
df_mini <-review_info %>%
separate(col=title,into=c("title","tagline"),sep="review", extra = "merge") %>%
mutate(tagline=str_sub(tagline,3)) %>% # removes unnecessary hyphen
mutate(date=as.Date(date)) %>%
mutate(rating=as.integer(rating)) %>%
mutate(categories=str_split(categories,","))
df_mini <- cbind(df_mini,link=review_links)
glimpse(df_mini)
## Observations: 40
## Variables: 8
## $ title <chr> "Fireworks ", "A Caribbean Dream ", "Watch the tra...
## $ tagline <chr> " anime romance sparkles with strangeness", " Shak...
## $ description <chr> "This disorientating teen tale think Japans ans...
## $ author <chr> "Peter Bradshaw", "Cath Clarke", NA, "Peter Bradsh...
## $ date <date> 2017-11-10, 2017-11-10, 2017-11-09, 2017-11-09, 2...
## $ categories <list> [<"Animation", "World cinema", "Film", "Culture",...
## $ rating <int> 3, 3, NA, 5, 3, 3, 4, 3, 4, 4, 4, 5, 3, 2, 3, 2, 3...
## $ link <fctr> https://www.theguardian.com/film/2017/nov/10/fire...
# the data cannot easily be saved in csv or feather format when there are list-columns
saveRDS(df_mini,"data/movieReviewsMini.rds")
Meaningful Data
The above code indicates the process but obviously is pretty limited in terms of helping choose a movie on Netflix
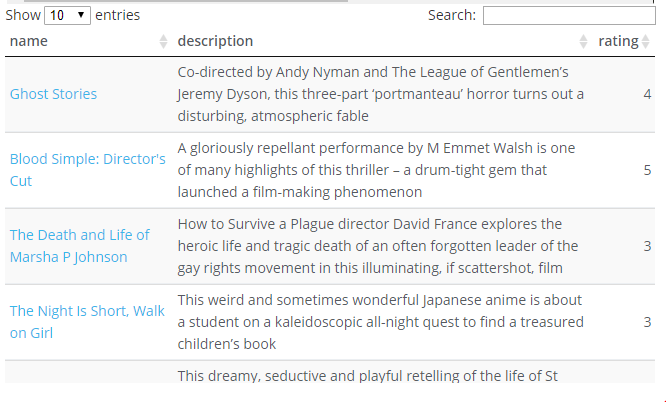
I have, however, collated, 8000 reviews in total, covering the latest 6+ years.
Review Links
With this number, the data is fairly large to show in a datatable so I have cut down to the bare minimum of name, description and rating It may still take a long while. If you want to play around with the data an alternative to datatables might be considered. Alternatively, the dataset could be reduced in size by filtering by date, rating, genres of interest etc.
The ‘name’ field is a conflation of the title and link and clicking on it will open a new tab in your browser with the review page
The data is ordered by descending date and is searchable.
df <- readRDS("data/movieReviews.rds")

df %>%
mutate(name = paste0("<a href=", link, ">", title, "</a>")) %>%
  select(name,description,rating) %>%
                         DT::datatable(class='compact stripe hover row-border order-column',rownames=FALSE,escape = FALSE,options= list(paging = TRUE, searching = TRUE,info=FALSE))
# df %>%
#   filter(rating==5) %>%
#                          DT::datatable(class='compact stripe hover row-border order-column',rownames=FALSE,options= list(paging = TRUE, searching = TRUE,info=FALSE))
#
# # It seems your data is too big for client-side DataTables. You may consider server-side processing: http://rstudio.github.io/DT/server.htmlIt seems your data is too big for client-side DataTables. You may consider server-side processing: http://rstudio.github.io/DT/server.html
#
#
# fiveStars <- df %>%
#   mutate(name = paste0("<a href=", link, ">", title, "</a>")) %>%
#   filter(rating==5)  %>% #396 #1702944 bytes from object.size
#   #select(-c(categories,description)) #1442456 bytes
#     select(name,description,author,date,rating)
#
#
#
# fiveStars %>%
#   #head() %>%
#                          DT::datatable(class='compact stripe hover row-border order-column',rownames=FALSE,escape = FALSE,options= list(paging = TRUE, searching = TRUE,info=FALSE))
#
#
# df_new %>%
#   mutate(name = paste0("<a href=", link, ">", title, "</a>")) %>%
#   select(name,description,rating) %>%
#                          DT::datatable(class='compact stripe hover row-border order-column',rownames=FALSE,escape = FALSE,options= list(paging = TRUE, searching = TRUE,info=FALSE))
#
# # dput(df,"data/movieReviews")
# # df_new <- dget("data/movieReviews")
# # identical(df,df_new) #FALSE
# #
# # library(dataCompareR)
# # rCompare(df,df_new)
# # # Running rCompare...
# # # Error in (function (..., row.names = NULL, check.rows = FALSE, check.names = TRUE,  :
# # #   arguments imply differing number of rows: 13, 6, 7, 5, 8, 11, 3, 4, 9, 2, 10, 12, 17, 20, 15, 14, 16, 18, 22, 25, 19, 21, 1
# #
# #
# # ## Look for Romance
# # df_new %>%
# #   filter(map_lgl(categories, ~ "Romance" %in% .x))
# #
# # genres <- as.data.frame(table(df))
# #
# # #df$categories %>% unlist() %>% sort() confirms there are 6
# #
# # genres <-df$categories %>%
# #   unlist() %>%
# #   table() %>%
# #   as.data.frame()
# #
# # names(genres) <- c("category","count")
# # ## includes more than just genres
# #
# #
# # write.csv(df,"data/movieReviewsSmall.csv")
# # save(df, file = "data/movieReviewsSmall.RData")
# #
# # df_new <- load(file = "data/movieReviewsSmall.RData")
# #
# # identical(df,df_new)
# #
# #
# # dput(mean, "foo") #type file
# # ## And read it back into 'bar'
# # bar <- dget("foo")
# #
# # dput(df,"data/movieReviewsSmall")
# #
# # dput(review_info_lots,"data/movieReviewsRaw")
# # df_new <- dget("data/movieReviewsSmall")
# # # library(feather)
# # # write_feather(df,"data/movieReviewsSmall.feather")# same error
This seems to do the trick. So for instance, if you wanted a Meryl Streep film entering her name in the search field is likely to come up with a good selection based on her name appearing in the description
Further Analysis
As we have the data available, I might as well dlve a little further
Let’s look at the reviewers
# df %>%
#   count(author, sort=TRUE)

author_most <-df %>%
  group_by(author) %>%
  summarise(count=n(),`Av. rating`=round(mean(rating,na.rm=TRUE),1)) %>%
  arrange(desc(count))

author_most  %>%
                         DT::datatable(width=250,class='compact stripe hover row-border order-column',rownames=FALSE,options= list(paging = TRUE, searching = TRUE,info=FALSE))
So 253 have contributed over the full period but Peter Bradshaw, as the Guardian film critic throughout this period, has filed more than double anybody else. He tends to rank moviews more favourably than some of his colleagues. For some reason, Philip French does not provide a rating
Here is a more detailed look at the top 15
# df %>%
#   group_by(author) %>%
#   plot_ly(x=~rating, color=~author) %>%
#   add_boxplot()

## poss exploding boxplot but then might have prob with names
## order by

major_critics <- df %>%
  count(author, sort=TRUE) %>%
  head(15) %>%
  pull(author)

# major_critics <- df %>%
#   count(author, sort=TRUE) %>%
#   head(15)

# all v samey
# df %>%
#   filter(author %in% major_critics) %>%
#   plot_ly(x=~rating, color=~author) %>%
#   add_boxplot() %>%
#   layout(margin=list(l=150)) %>%  config(displayModeBar = F,showLink = F)

#library(forcats) #y=~fct_reorder(TEAMNAME, n)

df %>%
  filter(author %in% major_critics) %>%
  #left_join(major_critics) %>%
  #plot_ly(x=~date,y=~fct_reorder(author, n),color=~as.factor(rating), # some miss out
  plot_ly(x=~date,y=~author,color=~as.factor(rating),
          hoverinfo="text",
          text=~paste0(title)) %>%
  add_markers(size=I(4L))  %>%
  layout(margin=list(l=100),
         title="Leading Movie Reviewers - Guardian Group",
         xaxis=list(title=""),
         yaxis=list(title="")
         ) %>%

  config(displayModeBar = F,showLink = F)
You can click on the legend to toggle between star ratings and zoom in for a period of time/author. Hover points for movie titles
Wendy Ide is film critic of the Observer - the Guardian’s Sunday sister paper - but male contributors dominate
Let’s have a quick look at genre
genres <-df$categories %>%
  unlist() %>%
  table() %>%
  as.data.frame()

names(genres) <- c("Genre", "Count")

genres %>%
  arrange(desc(Count)) %>%
   DT::datatable(class='compact stripe hover row-border order-column',rownames=FALSE,options= list(paging = TRUE, searching = TRUE,info=FALSE))
Genres covers a wide range but further analysis of change over time, ratings and incorporation into the initial search table could be done
Other work in this area that could be done
- link to netflix etc. availability by country
- link to imdb/wikipedia/rotten tomatoes/metacritic coverage
- Textual analysis of reviews
- Create shiny app to fine tune selections and keep reviews contemporary