After a long spate of just soccer posts, it is a relief(delayed pun intended) to turn to a quick look at a relatively new package, weathercan released under the https://ropensci.org/ banner by [@steffilazerte](Steffi LaZerte), who has written a comprehensive blog post about it
The package provides historical weather data from Environment and Climate Change Canada’s website.
Many years ago, I briefly lived in Victoria, BC, Canada and recalled it as a very agreeable climate so moving to North Vancouver I was expecting much of the same. It does not feel like that (: and this package gives me a chance to see if my subjective assessment of unremitting gloom - at least for several months of the year - is justified
Let’s first see what weather stations are currently available in BC and that provide at least daily returns
## # A tibble: 222 x 8
##    station_name         station_id   lat   lon   elev interval start   end
##    <chr>                <fct>      <dbl> <dbl>  <dbl> <chr>    <int> <int>
##  1 CHEMAINUS            26          48.9 -124.  75.0  day       1919  2018
##  2 COWICHAN LAKE FORES~ 37          48.8 -124. 177.   day       1949  2018
##  3 DISCOVERY ISLAND     27226       48.4 -123.  18.9  day       1997  2018
##  4 ESQUIMALT HARBOUR    52          48.4 -123.   3.00 day       1957  2018
##  5 GALIANO NORTH        55          49.0 -124.   6.00 day       1975  2018
##  6 MALAHAT              65          48.6 -124. 366.   day       1920  2018
##  7 METCHOSIN            68          48.4 -124. 164.   day       1911  2018
##  8 NORTH COWICHAN       76          48.8 -124.  45.7  day       1981  2018
##  9 NORTH COWICHAN       46728       48.8 -124.  44.8  day       2007  2018
## 10 NORTH PENDER ISLAND  77          48.8 -123.  98.0  day       1972  2018
## # ... with 212 more rows
So the data provided includes a location and elevation (in metres)
Let’s first see what weather stations are currently available near where I live and that provide at least daily returns
## # A tibble: 13 x 9
##    station_name         station_id   lat   lon   elev interval start   end
##    <chr>                <fct>      <dbl> <dbl>  <dbl> <chr>    <int> <int>
##  1 N VANC GROUSE MTN R~ 823         49.4 -123. 1.10e3 day       1971  2018
##  2 N VANCOUVER WHARVES  833         49.3 -123. 7.00e0 day       1962  2018
##  3 VANCOUVER HARBOUR CS 888         49.3 -123. 2.50e0 day       1925  2018
##  4 BURNABY SIMON FRASE~ 731         49.3 -123. 3.66e2 day       1965  2018
##  5 WEST VANCOUVER AUT   6833        49.4 -123. 1.70e2 day       1992  2018
##  6 PORT MOODY GLENAYRE  834         49.3 -123. 1.30e2 day       1970  2018
##  7 POINT ATKINSON       844         49.3 -123. 1.40e1 day       1968  2018
##  8 RICHMOND OPERATIONS~ 48448       49.2 -123. 1.60e1 day       2010  2018
##  9 RICHMOND DALLYN 2    853         49.2 -123. 1.80e0 day       1963  2018
## 10 RICHMOND NATURE PARK 837         49.2 -123. 3.00e0 day       1977  2018
## 11 VANCOUVER INTL A     51442       49.2 -123. 4.30e0 day       2013  2018
## 12 VANCOUVER SEA ISLAN~ 51357       49.2 -123. 2.11e0 day       2013  2018
## 13 DELTA BURNS BOG      49088       49.1 -123. 3.11e0 day       2011  2018
## # ... with 1 more variable: distance <dbl>
Unfortunately, there is nothing on my doorstep (actually maybe just as well) I know from this handy site that the elevation at my location is 142 metres
Data provided by weather stations is inconsistent, so I want to be sure that the chosen station(s) will provide what I am after. Let’s look at what variables are potentially available from local stations and how well they were covered in, say, January 2018
##  [1] "station_name"       "station_id"         "lat"
##  [4] "lon"                "elev"               "climate_id"
##  [7] "WMO_id"             "TC_id"              "prov"
## [10] "date"               "year"               "month"
## [13] "day"                "qual"               "cool_deg_days"
## [16] "cool_deg_days_flag" "dir_max_gust"       "dir_max_gust_flag"
## [19] "heat_deg_days"      "heat_deg_days_flag" "max_temp"
## [22] "max_temp_flag"      "mean_temp"          "mean_temp_flag"
## [25] "min_temp"           "min_temp_flag"      "snow_grnd"
## [28] "snow_grnd_flag"     "spd_max_gust"       "spd_max_gust_flag"
## [31] "total_precip"       "total_precip_flag"  "total_rain"
## [34] "total_rain_flag"    "total_snow"         "total_snow_flag"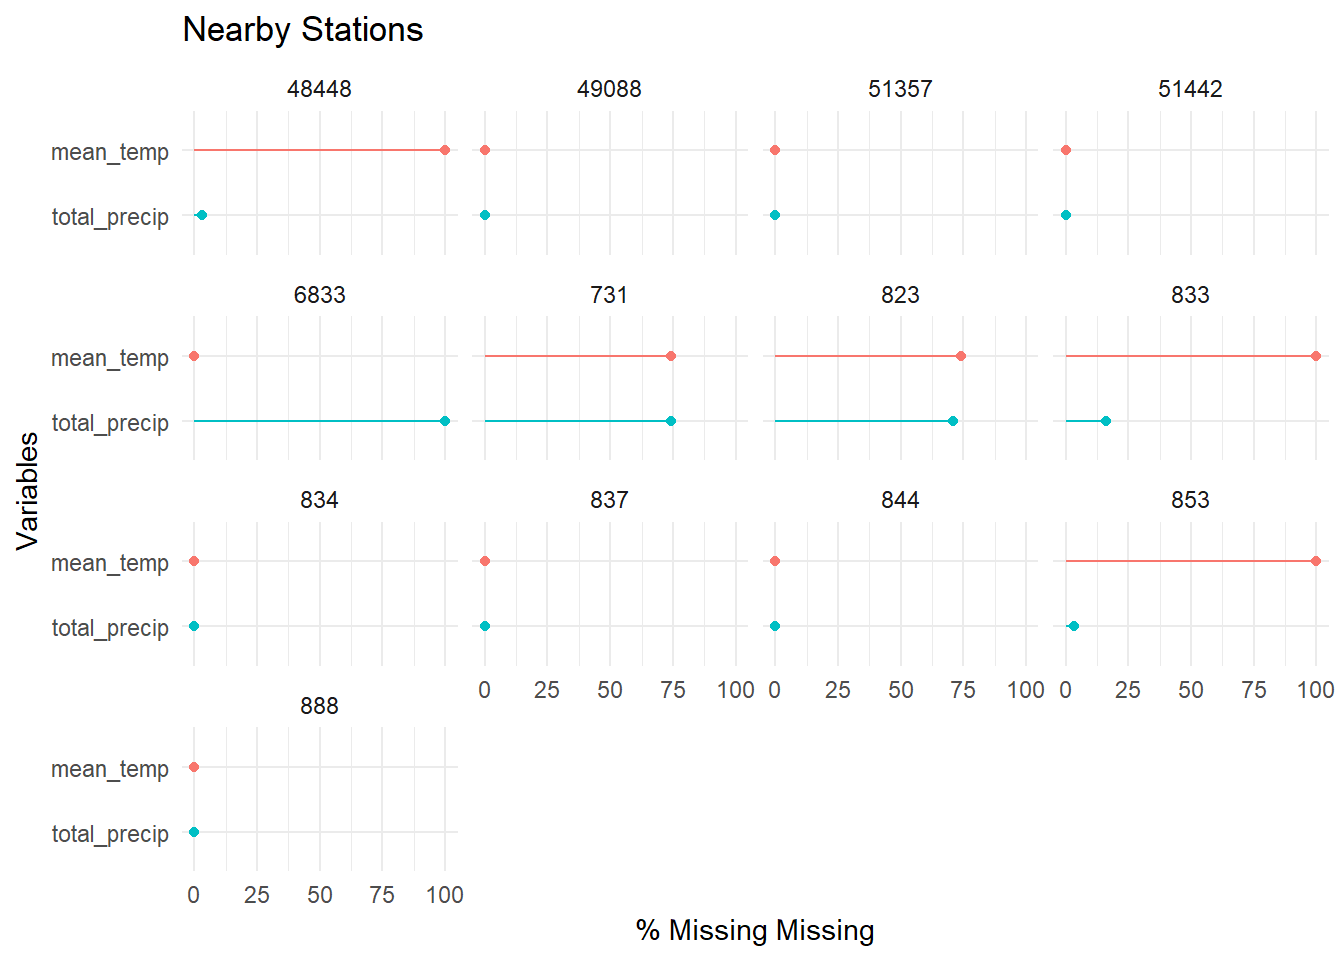
So around half the stations have no missing data. 834 is at a comparable elevation and 888 not too far away - but at sea level
From a similar process for the Victoria area I obtain another station 52, Esquimalt Harbour at sea level, which seems a good choice
Now lets get precipitation and temperature data for a full year, 2017, for these three locations
This shows quite a variation between the sites. Comparing the two sea level locations, Vancouver’s total annual rainfall of 1.5m is two and a half times that that of Esquimalt(0.6). Higher up in the clouds - at least for these locations - adds a further 0.2m
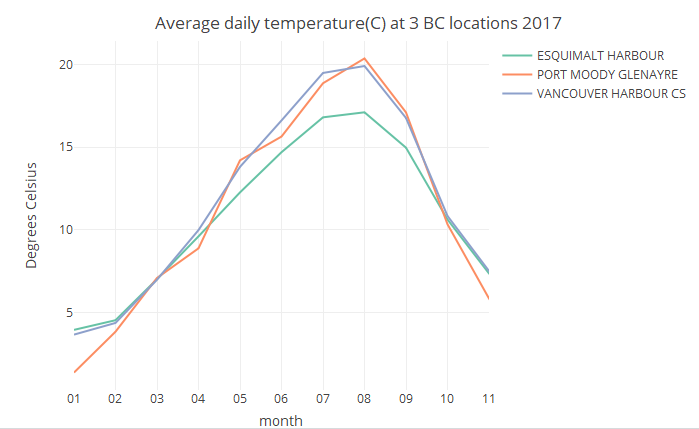
How about temperatures?
Interstingly, the summers are 2-3C hotter on the mainland, with the elevated station averaging 0.4 degrees lower than Vancouver Harbour over the year as a whole
For me, the slightly warmer winters do not really make up for the significant increase in rainfall so maybe it’s time to move back to Vancouver Island. Still there is more to life than the climate…